Well report No. RR-3838 · T8N · R36W · SEC 8 · filed November 12, 2026
Gas & LNGWell report
Flex LNG Q3 revenue reaches $97 million as fleet TCE nears $79,000
Flex LNG reported $97 million of sailed-in revenue, nearly $79,000 per day in fleet TCE and $42.8 million of net income for Q3 2026 on November 11, 2026.
Field notes
- Q3 2026 sailed-in revenue reached $97 million, or $95 million excluding EUAs.
- Fleet-average TCE was close to $79,000 per day.
- Net income was $42.8 million and earnings per share were $0.79.
- Adjusted net income was $35.0 million and adjusted earnings per share were $0.65.
- The earnings call took place on November 11, 2026, at 9:00 a.m. EST.
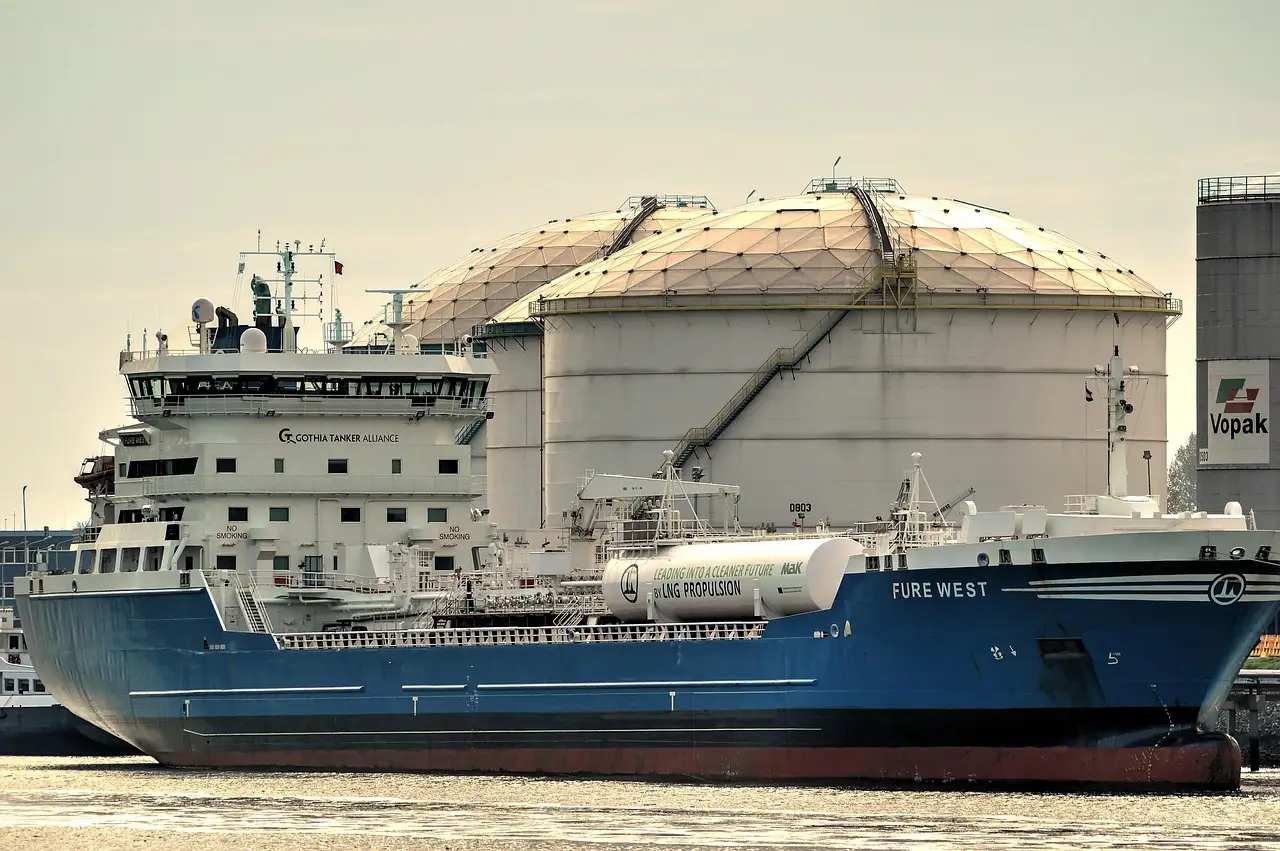
Flex LNG Ltd. reported $97 million of sailed-in revenue for Q3 2026, or $95 million excluding EUAs, during an earnings call held at 9:00 a.m. EST on November 11, 2026. The company also posted a fleet-average time charter equivalent (TCE) of close to $79,000 per day.
The operating results accompanied $42.8 million of net income and $0.79 of earnings per share. CEO Marius Foss said: “We are happy to present our strongest third quarter results ever.” Those figures define the quarter in the presentation; the supplied excerpt provides no fleet count or LNG market forecast.
What do the revenue and TCE figures show?
Flex LNG presented two revenue bases and one fleet-wide earnings rate:
- Sailed-in revenue of $97 million for Q3 2026.
- Sailed-in revenue excluding EUAs of $95 million.
- Fleet-average TCE of close to $79,000 per day.
The $2 million difference between the two revenue figures is the arithmetic gap between the totals Flex LNG disclosed. The TCE figure represents the daily rate across the fleet rather than the rate earned by an individual vessel. The excerpt does not provide fleet size, vessel utilization or vessel-level TCE rates.
The practical takeaway: Flex LNG earned close to $79,000 per day across its fleet while reporting $95 million of sailed-in revenue excluding EUAs.
How did unrealized gains affect reported profit?
Flex LNG’s Q3 profit carried a $7.8 million difference between the GAAP result and management’s adjusted figure:
- Net income of $42.8 million.
- Earnings per share of $0.79.
- Adjusted net income of $35.0 million.
- Adjusted earnings per share of $0.65.
The adjustment removes unrealized gains on interest-rate swaps and foreign exchange. It reduces net income by $7.8 million, or 18.2%, and earnings per share by $0.14. The $42.8 million headline therefore includes $7.8 million of unrealized gains that management excluded from its adjusted result.
CFO Knut Traahholt said: “Today, we will be using some non-GAAP measures such as TCE, adjusted EBITDA and adjusted net income.” He said those measures supplement the earnings report prepared under U.S. GAAP and that reconciliations appear in the report. The excerpt provides no adjusted EBITDA amount, so readers should consult the report rather than infer one from net income.
Traahholt also advised listeners to read the quarterly report with the presentation because the presentation has limits. The practical takeaway: management’s comparable quarterly profit was $35.0 million, $7.8 million below reported net income.
What does the excerpt reveal about the fleet and LNG market?
The call agenda covered Q3 results, an LNG market update and a question-and-answer session. However, the supplied transcript stops before management gives a substantive LNG price view, charter-rate forecast or operating guidance. It would therefore be wrong to attribute a bullish or bearish market outlook to this passage.
Traaholt invited questions through the webcast chat or by email at [email protected]. The excerpt then turns to two named ships and says Flex Artemis and Flex Volunteer continue to contribute. It cuts off before quantifying their revenue, earnings, TCE or duration of contribution.
For practitioners, that leaves an important gap. The fleet-average TCE shows the combined daily rate, while the named-vessel statement confirms that both ships contributed. Neither disclosure shows the performance spread between those vessels and the fleet average, or reveals whether one ship drove most of the quarterly result.
The practical takeaway: the excerpt confirms contributions from Flex Artemis and Flex Volunteer but does not quantify either vessel or support a vessel-level earnings conclusion.
Watch item: The full Q3 report and earnings presentation, particularly the non-GAAP reconciliations and any vessel-level detail for Flex Artemis and Flex Volunteer, are the next documents needed to complete the operating picture.
via seekingalpha.com (Source)
More from James Calloway
Show full bio
Staff writer covering people, launches and day-to-day practice in Oil and gas industry operations and markets at Rig & Refinery.
597 articles
Adjoining reports
- TotalEnergies Q3 profit doubles as refining margin averages $33.2/bbl
- Tidewater Q3 revenue rises 5.3% as vessel rates strengthen
- Chevron Books $9.9bn Q3 Net Income as Downstream Earnings Nearly Quintuple
- Yinson clinches RM2.5 billion FPSO contract extension
- Yinson books RM2.5 billion FPSO charter extension: report