Well report No. RR-3112 · T4N · R41W · SEC 4 · filed November 3, 2026
Refining & PetrochemicalsWell report
Global Refinery Runs Fell 4.8 Million B/d in 2Q26, Kpler Data Show
Global refinery crude runs dropped 4.8 million b/d, or 6%, in 2Q26 after Middle East conflict, Kpler data show; a 1.8-million-b/d 3Q26 rebound still left throughput 5% below 2025.
Field notes
- Global refinery crude inputs fell 4.8 million b/d (6%) in 2Q26, per Kpler, then rebounded 1.8 million b/d in 3Q26.
- China's runs fell 2.1 million b/d in 2Q26 and another 0.8 million b/d in 3Q26.
- US refinery inputs rose 0.5 million b/d in each of 2Q26 and 3Q26 on higher product exports.
- Diesel prices hit their highest nominal levels on record in September.
- 3Q26 global crude inputs still averaged about 5% below 3Q25.
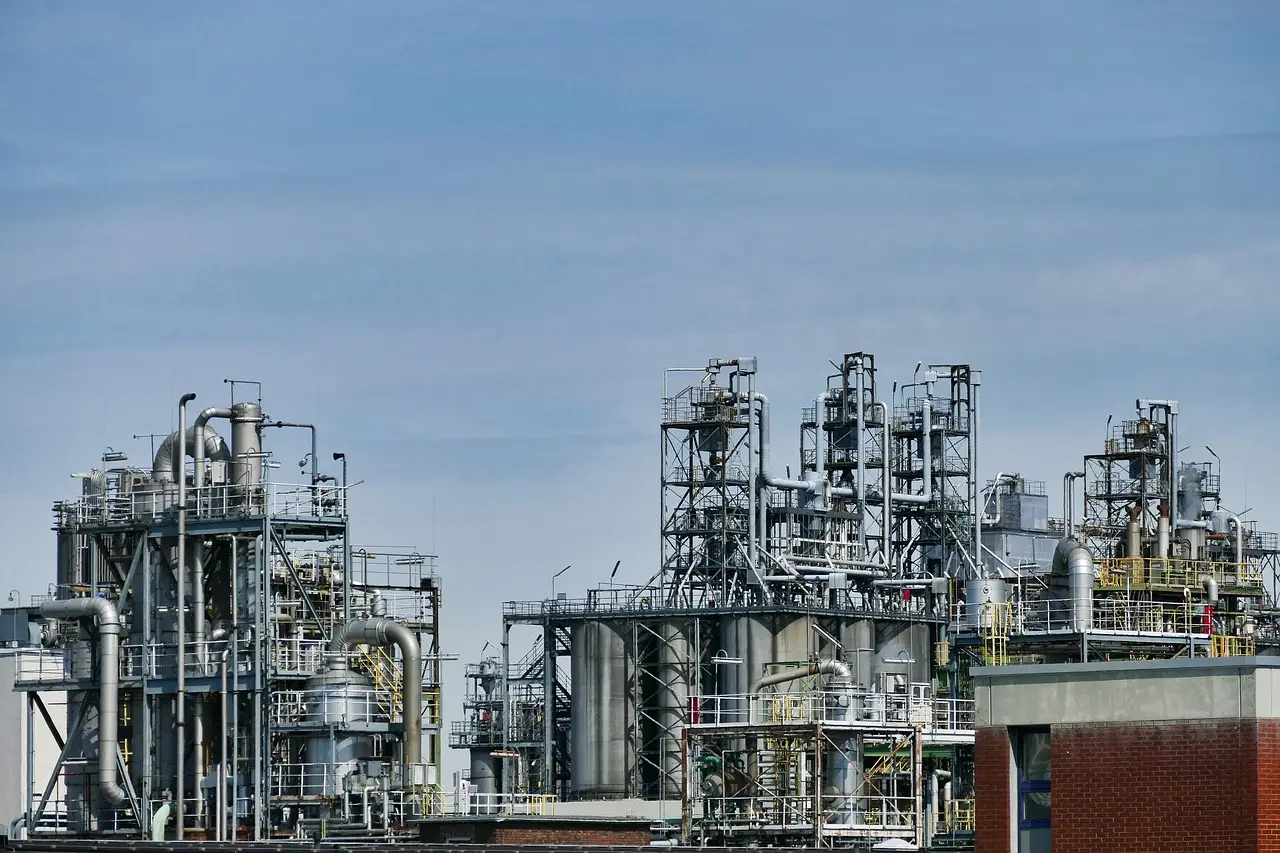
Global crude runs fell 4.8 million b/d in the second quarter of 2026. That is a 6% drop in a single quarter, according to Kpler data, and it followed the late-February start of conflict in the Middle East. Throughput recovered by 1.8 million b/d in the third quarter as refiners adjusted to redrawn trade flows.
The timing made the fall look worse than the raw numbers suggest. Refiners normally raise runs in the second and third quarters as planned maintenance ends and gasoline and jet fuel demand peaks. In 2025, the seasonal pattern held: global crude inputs rose 0.3 million b/d in 2Q25 and another 2 million b/d in 3Q25. This year the season inverted. Verdict: a 6% quarterly contraction against a rising seasonal baseline is a genuine supply shock, not a maintenance artifact.
Where did the barrels stop moving?
The losses concentrated where the Strait of Hormuz mattered most. The world's four largest refining nations by capacity are the United States, China, Russia, and India, and three of the four posted declines.
- China: runs fell 2.1 million b/d in 2Q26 and another 0.8 million b/d in 3Q26, the steepest and most persistent drop.
- India, South Korea, and Japan: collectively down more than 1.0 million b/d in 2Q26, then up 0.8 million b/d in 3Q26.
- Kuwait: down 0.7 million b/d; UAE: down 0.7 million b/d; Saudi Arabia: down 0.3 million b/d; Iran: down 0.2 million b/d in 2Q26. The four recovered a combined 0.4 million b/d in 3Q26.
The Middle East declines cut both ways. The strait closure limited crude supply into Asian refineries and, at the same time, blocked refined product exports out of Gulf complexes, removing the economic case to keep those plants full. Plain takeaway: Hormuz chokepoints squeeze inputs and outlets at once.
Russia compounded the problem from the other direction. Attacks on Russian oil infrastructure during the war in Ukraine cut refinery crude inputs by 0.6 million b/d in 2Q26 and a further 0.8 million b/d in 3Q26. Russia is a major diesel exporter, and those losses landed on a diesel market already tight from earlier geopolitical disruption. The combined loss of Russian, Asian, and Middle East refining helped push diesel prices to their highest nominal levels on record in September, by Kpler's account of the sequence.
Who picked up the slack?
The United States ran against the current. US refinery crude inputs rose 0.5 million b/d in 2Q26 and another 0.5 million b/d in 3Q26, as American refiners exported more refined product to fill the gap left by disabled competitors elsewhere. Other regions with access to alternative supply posted gains as well. For context, the 1.0-million-b/d two-quarter US increase offset roughly a fifth of the global 2Q26 decline on its own.
The third-quarter recovery had identifiable mechanics. Increased flows through the Strait of Hormuz, alternative routing, and ship-to-ship transfers returned more Middle Eastern crude to the market, feeding the 1.8-million-b/d rebound in global runs. Even so, 3Q26 crude inputs averaged about 5% below the same period of 2025. The recovery was real but incomplete: the system found workarounds, yet it ended the quarter short of where it stood a year earlier.
What is the watch item?
Product margins, above all diesel. The September nominal record reflects refining capacity lost faster than trade flows could reroute it, and the 3Q26 recovery still leaves global runs below year-ago levels. Watch whether Hormuz flows, ship-to-ship transfers, and US export volumes hold through the fourth quarter, and whether Russian runs stabilise. Diesel will tell the story first.
via EIA Today in Energy (Source)
More from Daniel Okafor
Show full bio
Market editor covering companies, deals and strategy in Oil and gas industry operations and markets at Rig & Refinery.
556 articles
Adjoining reports
- IEA sees 2.6 million b/d demand drop in 2026, supply rebound fragile
- US Crude Stocks Rise 900,000 bbl as Refinery Runs Slip to 16.3 Million b/d
- China Taps Reserves as Iranian Crude Dries Up, NEA Orders More Drilling
- OPEC Trims 2026 Oil Demand Growth Outlook to 400,000 Bpd
- OPEC Trims 2026 Oil Demand Growth Forecast to 400,000 Bpd