Well report No. RR-2633 · T13N · R39W · SEC 1 · filed October 10, 2026
Upstream Drilling & ProductionWell report
U.S. Rig Count Climbs to 603 as Oil Activity Outpaces Gas
Baker Hughes pegs the U.S. rig count at 603, with oil rigs up six to 462 and gas rigs down one to 132. The total fleet sits 56 units above the year-ago week as operators tilt toward liquids.
Field notes
- U.S. total rig count at 603, up 56 from the year-ago week
- Oil rigs rose by 6 to 462, up 44 year-on-year
- Gas rigs fell by 1 to 132, still up 12 year-on-year
- Miscellaneous rigs unchanged at 9
- Data published by Baker Hughes on Friday
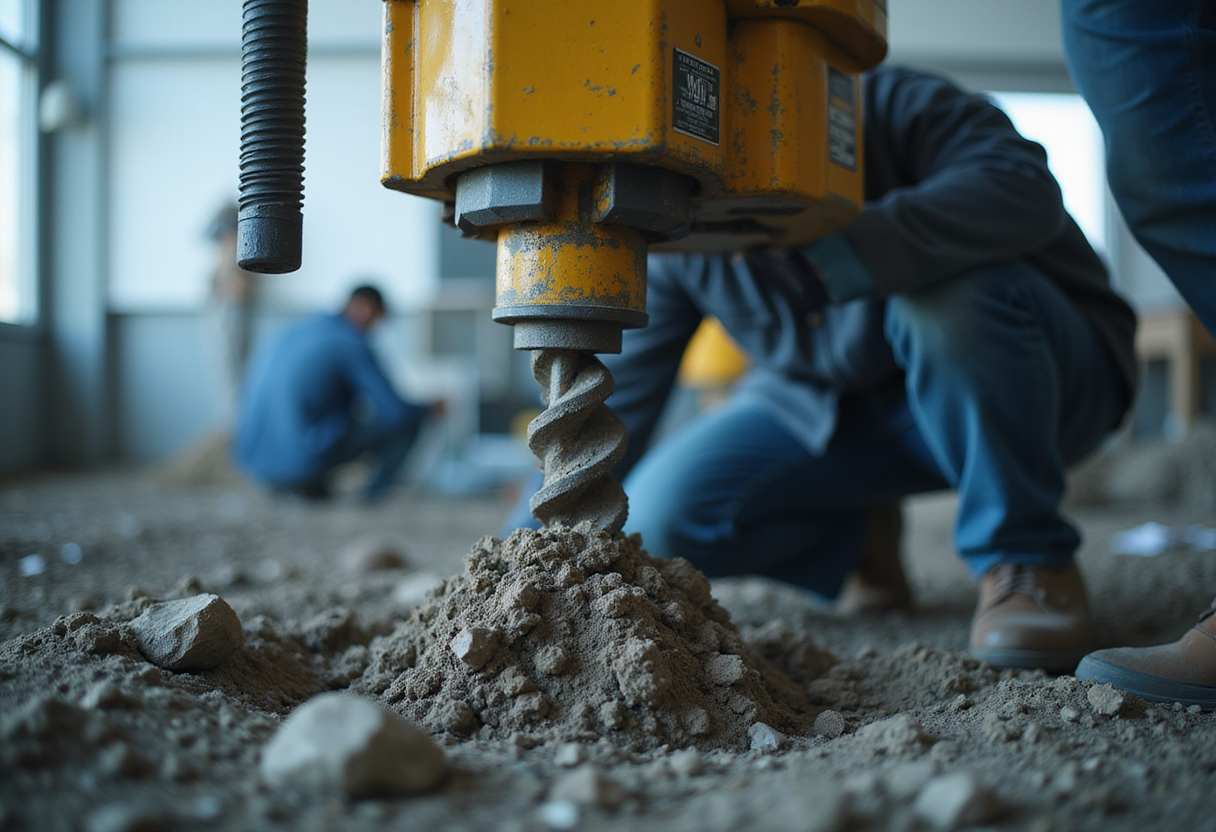
The U.S. drilling rig count climbed to 603 in the latest Baker Hughes survey, lifting the total active fleet by 56 units from the same week a year ago and extending a slow but steady recovery in upstream activity.
Oil-directed rigs drove the move. The oil rig count rose by six week-on-week to 462, sitting 44 units above the year-earlier reading. Gas rigs moved in the opposite direction, shedding one to 132, though that figure still represents a 12-rig gain year-on-year. Miscellaneous rigs held flat at nine.
Where does the mix sit now?
Of the 603 active units, oil-targeted drilling accounts for roughly 77% of the fleet, gas for about 22%, and miscellaneous for the remainder.
Operators have skewed toward liquids-rich plays in basins including the Permian, Eagle Ford and Bakken, where wellhead economics have held up despite softer benchmark pricing through recent quarters. The Permian alone has historically accounted for the largest share of the U.S. oil rig fleet.
The 462 oil count is among the higher readings of the post-2020 era, though it remains far below the 800-plus fleet the industry ran during the 2014 price-cycle peak.
The 132 gas reading is consistent with the constrained activity band that took hold after the late-2022 pullback, when operators trimmed dry-gas drilling in response to weaker Henry Hub realizations. The Marcellus and Haynesville have carried the bulk of gas-directed drilling through that period.
What does the year-on-year picture show?
The +56-rig gain in the total count reflects the gradual unwind of the post-pandemic activity downturn, the capital-discipline posture that public E&Ps have held to since 2020, and a measured return of private operators to active development programs. The build has played out over multiple quarters from the post-pandemic trough.
The +44 oil-specific gain — versus +12 in gas — shows how the recovery has tilted toward liquids, where breakeven costs in the best U.S. plays sit under $40 per barrel WTI. The oil-specific build also foreshadows higher U.S. crude output in EIA's monthly drilling productivity report, which uses rig counts and average per-rig productivity to estimate new-well oil production by basin.
Why service pricing matters
The pace of the oil-led build matters for service providers and midstream operators. Pressure pumpers, sand suppliers and frac crews typically see utilization tighten once the oil count holds above 450 for several consecutive weeks.
Operators have now sustained that level for an extended run, which translates into firmer day-rate discussions heading into 2026 contract cycles. Midstream take-away capacity in the Permian and Eagle Ford will feel the most direct leverage from continued oil-led additions.
How the survey works
Baker Hughes releases the rig count each Friday, drawing on direct operator reporting across the contiguous U.S., Alaska and the Gulf of Mexico. The series remains the industry-standard reference for week-to-week activity trends.
It feeds directly into the production-forecast models used by the EIA and private-sector analysts. The count captures rigs that are actively drilling a well; rigs rigging up, rigging down or in transit do not appear in the active tally. The survey traces back to 1944 and remains one of the longest continuous data sets in the global upstream industry.
Watch item
Operators and analysts will look to next Friday's Baker Hughes release for confirmation that the oil-led trend holds.
Beyond that, the EIA's weekly U.S. crude production estimate typically lags rig-count moves by two to four weeks. The agency separately publishes a monthly drilling productivity report that breaks new-well oil output by basin.
A sustained push past 475 oil rigs would mark a fresh post-2020 high; a retreat below 440 would reopen questions about the durability of the recovery and could pressure service pricing back toward recent lows.
via eia.gov (Original)
More from James Calloway
Show full bio
Staff writer covering industry trends and analytics at Rig & Refinery.
400 articles