Well report No. RR-6481 · T13N · R16W · SEC 13 · filed November 13, 2026
Petroleum MarketsWell report
WTI Down 17.5% From October Peak: Will the Decline Extend?
WTI has fallen 17.5% from its late-October peak near $105 to $86 on 10 November, as OPEC+ output jumped and US inventories built 4.7 million barrels.
Field notes
- WTI fell roughly 17.5% from a late-October peak near $105 to a ten-week low of $86 on 10 November.
- OPEC+ output jumped in October, led by a 26% increase in Saudi production.
- US crude inventories built 4.7 million barrels in the week ending 6 November.
- WTI closed at $88.74 on 12 November, up 2.6%, as Strait of Hormuz traffic was disrupted.
- Key technical levels: supply zone 91.355–92.191; bearish structure invalidates above 93.259.
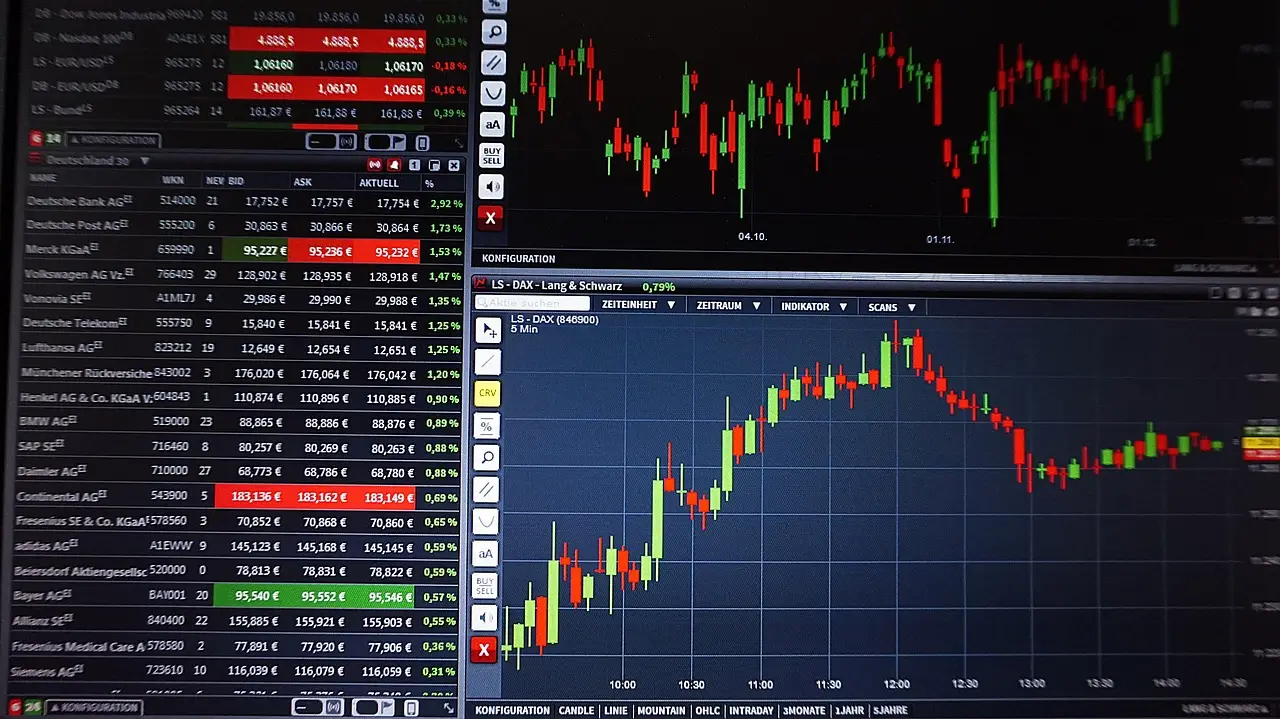
US crude has fallen roughly 17.5% from its late-October peak near $105 to a ten-week low of $86 on 10 November. The decline reflects two forces: easing geopolitical tensions that deflated the market's risk premium, and growing supply-side pressure from OPEC+ and US inventories.
What drove the sell-off?
The supply side turned decisively heavier in October. OPEC+ output jumped during the month, led by a 26% increase in Saudi production, according to the analysis published by CFI on TradingView.
US stockpiles reinforced the bearish picture. Crude inventories built by 4.7 million barrels in the week ending 6 November.
The takeaway: a fading risk premium plus rising supply left the market with less cushion against downside pressure.
How did prices respond?
The market recovered part of its losses on 12 November. WTI closed at $88.74, up 2.6% on the session, after geopolitical tensions escalated once again and shipping traffic through the Strait of Hormuz was disrupted.
The CFI analysis frames the resulting picture as split. On one side sit supply and inventory pressure. On the other sits a risk premium that reignites with every rise in geopolitical tension — a dynamic the analyst says is clearly reflected in the technical picture.
The takeaway: headline risk, not barrels, is now the marginal driver of daily price action.
What does the chart show?
The technical structure has shifted from bullish to bearish. An uptrend that extended from mid-October, supported by a well-defined ascending trendline, broke to the downside from the peak near $106.
Price then built a series of lower highs and lower lows on the four-hour (H4) chart. The highs declined from 106 to 100 and then to 93.259, against successive lower lows at 94.3, then 87.9, then 84.3 — the classic pattern confirming a change in market structure from bullish to bearish.
Price currently trades near 88.97 within a corrective rebound from the latest low. The zone between 91.355 and 92.191 stands out as a supply area based on the Fibonacci retracement tool (a method of projecting likely reversal levels from prior swing extremes).
The takeaway: the trend structure is bearish until a four-hour close reclaims the last lower high at 93.259.
Where are the levels to watch?
Two scenarios define the near-term range, according to CFI:
- Bearish: a rejection from the 91.355–92.191 supply zone could resume the decline toward the $86.00 area first, then the 84.3 low; a break of that low would extend the bearish wave toward lower levels.
- Bullish: any four-hour close above 93.259 would break the series of lower highs and bring the bullish scenario back into play.
The takeaway: the 91.355–92.191 zone is the decision point, with 93.259 as the line that invalidates the bearish case.
Watch items
Traders should track three variables in the sessions ahead: the fate of the corrective rebound at the 91.355–92.191 supply zone, any four-hour close above or below the structural levels at 93.259 and 84.3, and renewed escalation around the Strait of Hormuz that could rebuild the risk premium. Price commentary here is analysis attributed to CFI, not established fact.
via tradingview.com (Source)
More from Olivia Hart
Show full bio
Correspondent covering technology and product news in Oil and gas industry operations and markets at Rig & Refinery.
582 articles
Adjoining reports
- OPEC Output at 27.16 Million bpd Caps WTI Rally on Iran Comments
- Brent Slips Below $90 as OPEC Output Rebounds and Surplus Builds
- Brent Slides to $100.60 as Traders Price In a U.S.-Iran Deal
- Crude Surplus Returns: JPMorgan Sees 1.4 Million bpd in October
- Brent Back Above $96 as Gulf Shipping Incidents Offset Midterm Selloff