Well report No. RR-8480 · T20N · R47W · SEC 8 · filed November 12, 2026
Refining & PetrochemicalsWell report
Par Pacific's Strong Q3 Raises the Throughput Question
Par Pacific generated $3.05 billion in Q3 revenue, up 52% year over year, and held $226 million in net cash. The bullish case still hinges on throughput and refining margins.
Field notes
- Par Pacific operates about 219,000 bpd across four refineries in Hawaii, Washington, Wyoming and Montana.
- Third-quarter revenue rose 52% year over year to $3.05 billion.
- Adjusted EBITDA was $646 million and EPS reached $10.70.
- Par Pacific reported a $226 million net cash position.
- The analyst rates the stock a buy and cites 2.8x forward earnings and 2.5x EV/EBITDA.
By Priya Raman
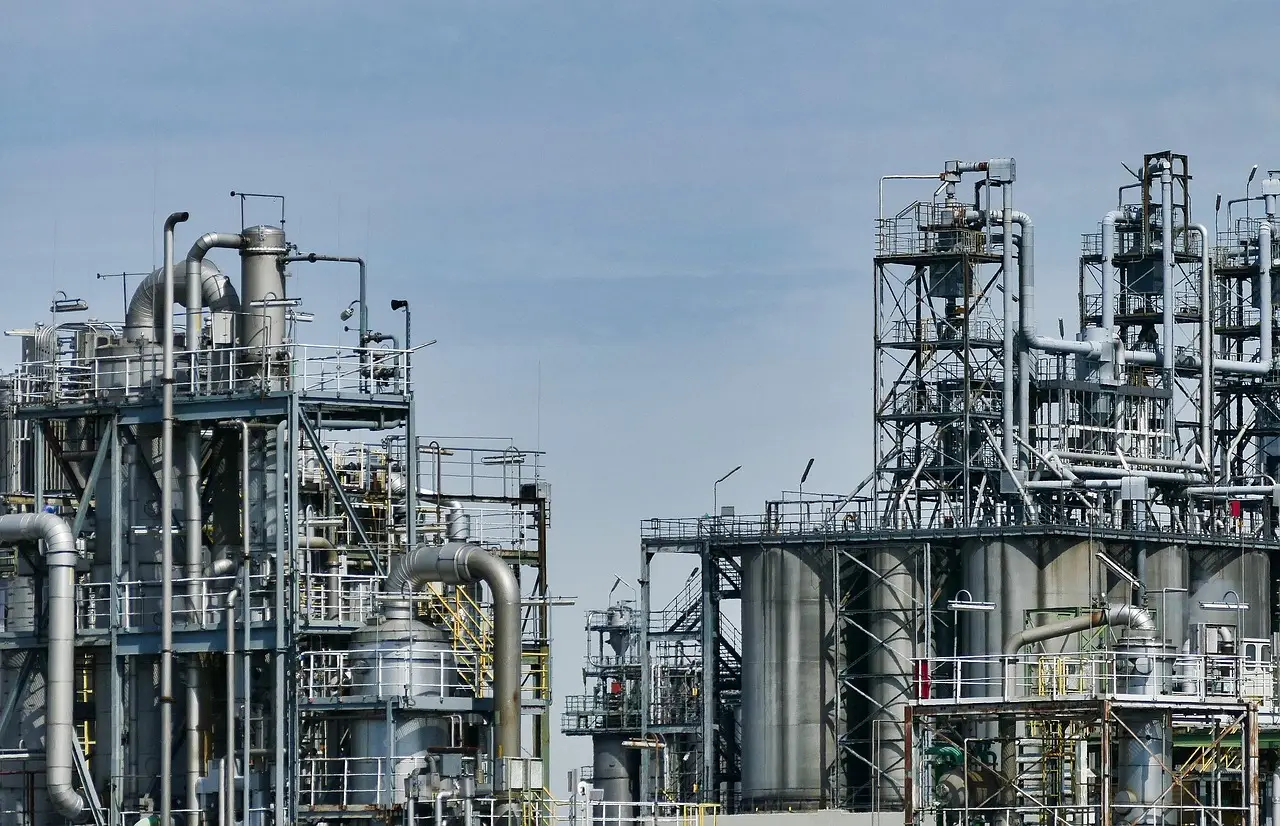
Par Pacific Holdings (PARR) operates approximately 219,000 barrels per day (bpd) of refining capacity across four refineries in Hawaii, Washington, Wyoming and Montana. That footprint frames the company’s operating exposure. The figures provided, however, are financial rather than operational.
What did the third quarter show?
According to the analyst, Par Pacific’s third-quarter revenue reached $3.05 billion. It rose 52% year over year. Adjusted EBITDA (earnings before interest, taxes, depreciation and amortization) totaled $646 million. Earnings per share (EPS) reached $10.70.
The analyst said the results remained strong even after excluding one-time SRE benefits. The source does not define SRE, itemize those benefits, or specify the EPS basis. That gap prevents a clean test of recurring earnings, because readers cannot separate the full contribution of normal refining operations from those one-time effects using only the figures provided.
The analyst also cited robust refining margins (the spread between refined-product sales and feedstock costs), improved financials, and a significant pullback as reasons for the bullish case. The pullback has no date or percentage in the source. Nor does the source identify the quarter’s calendar year.
In plain terms, the quarter was large, but its recurring earnings quality remains uncertain.
What underpins the resilience claim?
The analyst credits geographic diversity and integrated logistics for resilience in cyclical refining markets. Par Pacific spans refining, logistics, retail fuel distribution, and renewable fuels. Its $226 million net cash position (cash less borrowings) adds balance-sheet support.
Par Pacific’s operating reach covers four states. Hawaii, Washington, Wyoming and Montana anchor that geographic spread. But the source gives no refinery-level capacity split, utilization, crude-oil mix, product yield, or turnaround (scheduled maintenance) schedule, and it also does not quantify logistics assets, retail-fuel volumes, or renewable-fuel output.
In plain terms, diversification and net cash help, but operating detail is still missing.
Does the valuation support a buy rating?
The third-party analyst rates Par Pacific a buy. The shares trade at 2.8 times forward earnings and 2.5 times EV/EBITDA (enterprise value to EBITDA). The analyst calls that valuation deeply undervalued relative to sector medians.
Without the valuation date, peer set, earnings forecast, and enterprise-value reconciliation, the claimed discount cannot be tested directly against the financial figures presented in the source. The stated upside rests on higher refinery throughput (volume processed) and continued margin strength. Neither contribution receives a numerical target, margin rate or timetable. The source names no sanctioned expansion project or capacity addition behind that thesis.
Without a named project, higher throughput remains an operating assumption, not a scheduled project.
In plain terms, the claimed discount cannot be verified from the valuation data supplied.
Who is making the call?
The source does not identify the analyst by name. The analyst’s disclosure says: “I wrote this article myself, and it expresses my own opinions.” The author reports no stock, option, or similar derivative position in any company mentioned. They also report no plans to initiate such positions within the next 72 hours.
The author says they receive no compensation except from Seeking Alpha. The author has no business relationship with any company whose stock is mentioned.
Seeking Alpha’s disclosure adds: “Past performance is no guarantee of future results.” It says no recommendation or advice is given on whether an investment suits a particular investor. Views may not reflect Seeking Alpha as a whole.
The platform is not a licensed securities dealer, broker, U.S. investment adviser, or investment bank. Seeking Alpha’s analysts are third-party authors, including both professional investors and individual investors who may not be licensed or certified by any institute or regulatory body.
In plain terms, the buy label is an independent opinion, not personalized investment advice.
What should readers watch next?
Refining-margin performance is the first watch item. So is evidence that higher throughput can lift earnings without relying on one-time SRE benefits. The source identifies both as sources of upside but supplies no operating targets or schedule. The $3.05 billion revenue result shows scale. It does not settle earnings quality.
A future update on margins, throughput and net cash would test the resilience claim more directly than another valuation multiple presented without supporting operating data. Watch refining margins first; throughput and net cash are the supporting checks.
via seekingalpha.com (Source)
More from Priya Raman
Show full bio
Senior reporter covering technology and product news in Oil and gas industry operations and markets at Rig & Refinery.
599 articles
Adjoining reports
- Shell Q3 2026 net income doubles to $12.1bn on refining margins
- BP Posts $8.6 Billion Quarterly Profit as Refining Margin Hits $46.7/b
- Phillips 66 Posts $6.28 Billion Refining EBITDA in a Single Quarter
- Eni's Q3 Profit Doubles to $3.14 Billion on Refining Margin Surge
- Big Oil Banks Billions but Refuses to Splash the Cash